Wildlands & Woodlands
About
Vision
Who We Are
Pathways
Resource Library
Dashboard
Networks
ALPINE
Conservation Finance Network
Food Solutions New England
Northeast Forest Network (NFN)
RCP Network
From the Ground Up
Search
Topic:
Charts & Graphs
Resources
Charts & Graphs
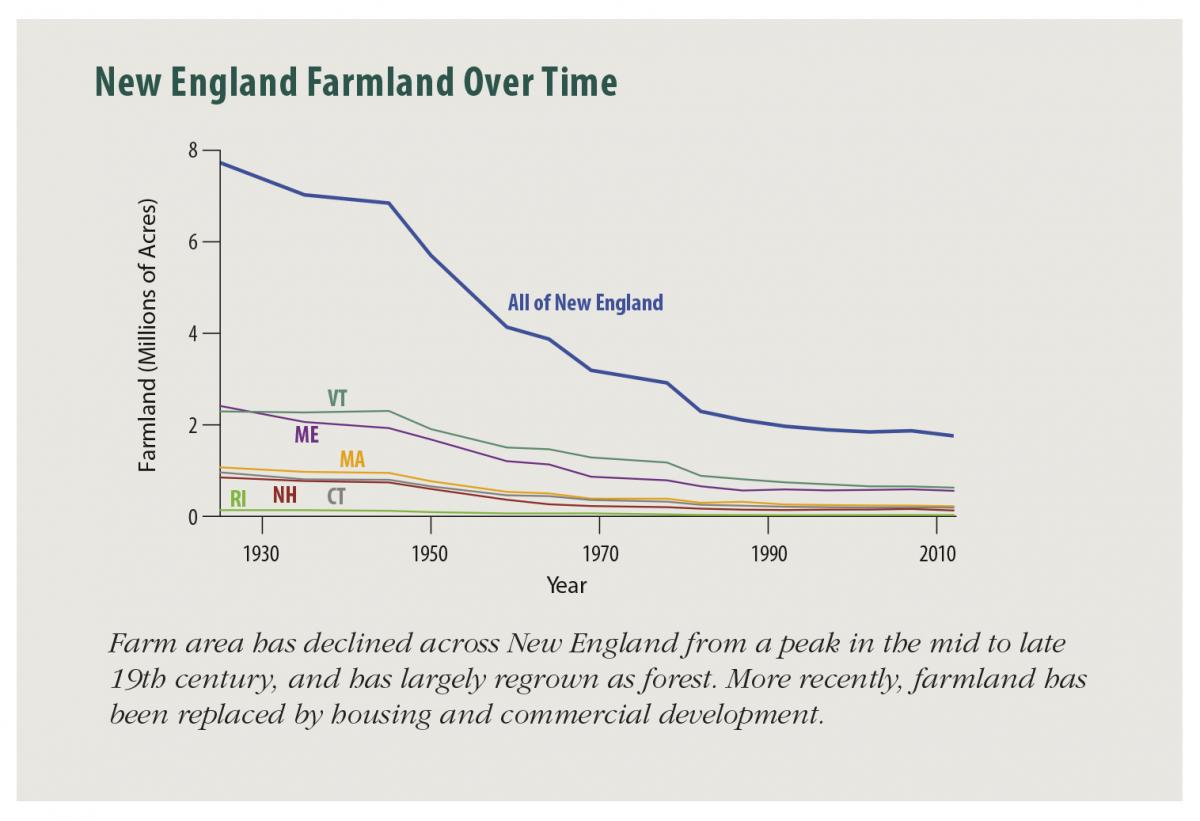
Figure 4 – New England Farmland Over Time (2017)
More Information
Less Information
Figure 4 from 2017 W&W Report. Data compiled from U.S. Agricultural Census reports by Brian Donahue and Sarah Sutton at Brandeis University.
Topics:
Charts & Graphs
,
WWF&C Vision
Resource Added March 19, 0207
View Resources
1
2
3
4
Just Released:
From the Ground Up
- Click to see the Autumn 2025 Issue
×
