More Information Less Information
Figure 11 from 2017 W&W Report. Data from the Harvard Forest, Highstead, and individual organizations.
More Information Less Information
Figure 10 from 2017 W&W Report. Data from: U.S. Geological Survey (USGS) Gap Analysis Program (GAP). 2016. Protected areas database of the US, PAD-US (CBI Edition). The Nature Conservancy (TNC). 2014. Secured lands geodatabase. Thompson, J. R., J. S. Plisinski, P. Olofsson, C. Holden, and M. Duveneck. In Review. Forest loss in New England: A projection of recent trends. James W. Sewall Co. 2015. Geospatial mapping.
More Information Less Information
Figure 9 from 2017 W&W Report. Data from: Thompson, J. R., J. S. Plisinski, P. Olofsson, C. Holden, and M. Duveneck. In Review. Forest loss in New England: A projection of recent trends. Olofsson, P., C. E. Holden, E. L. Bullock, and C. E. Woodcock. 2016. Time series analysis of satellite data reveals continuous deforestation of New England since the 1980s. Environmental Research Letters 11(6):1–8. Homer, C. G., J. A. Dewitz, L. Yang, S. Jin, P. Danielson, G. Xian, J. Coulston, N. D. Herold, J. D. Wickham, and K. Megown. 2015. Completion of the 2011 National Land Cover Database for the conterminous United States— representing a decade of land cover change information. Photogrammetric Engineering and Remote Sensing 81(5):345–354.
More Information Less Information
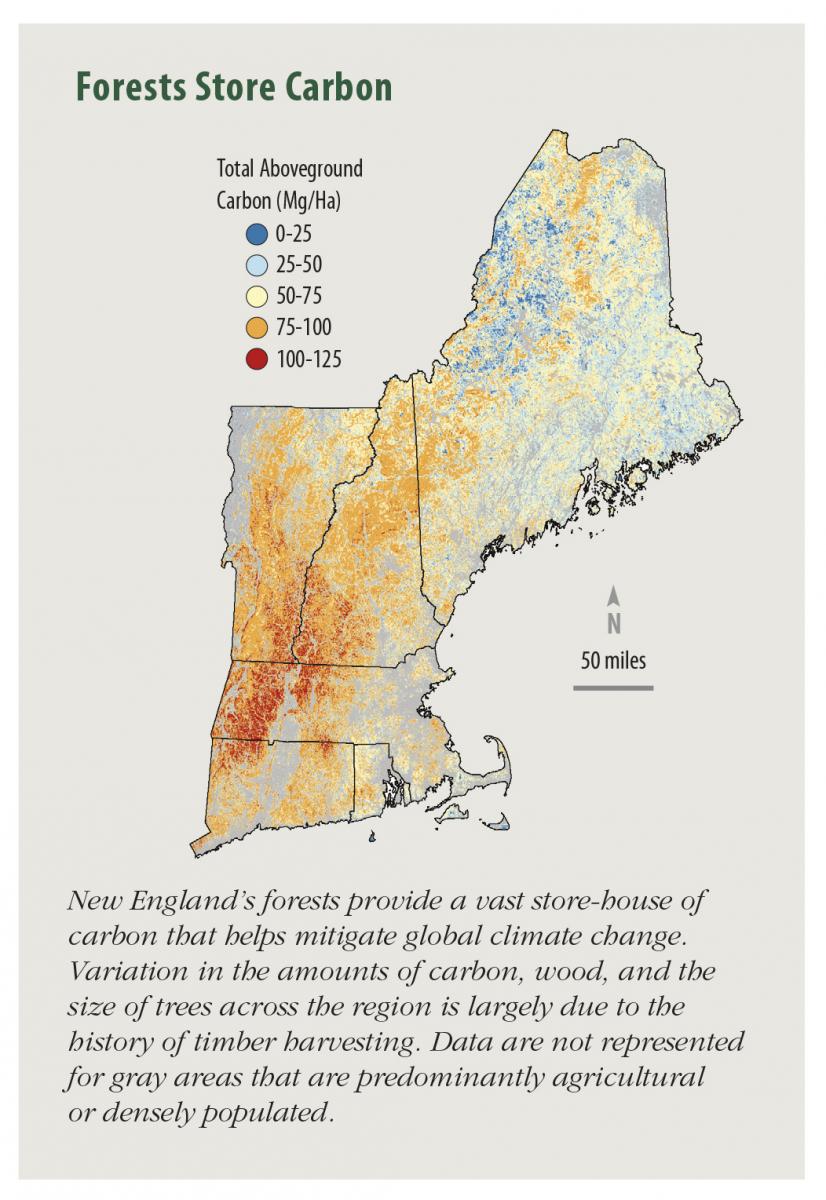
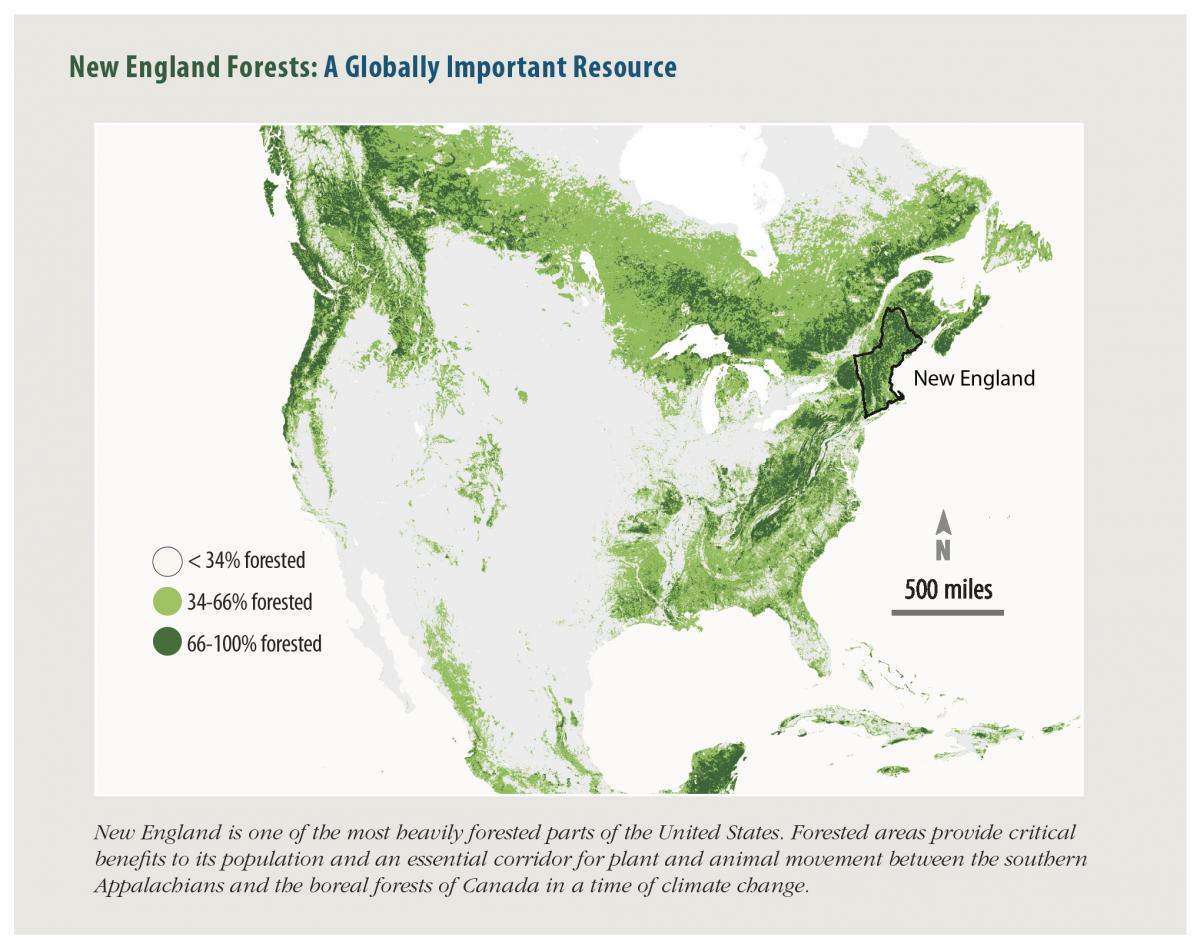
Figure 8 from 2017 W&W Report. Data from: Kellndorfer, J., Walker, W., LaPoint, E., Bishop, J., Cormier, T., Fiske, G., Hoppus, M., Kirsch, K., and Westfall, J. 2012. NACP Aboveground Biomass and Carbon Baseline Data (NBCD 2000), U.S.A., 2000. Data set. Available on-line at http://daac.ornl.gov from ORNL DAAC, Oak Ridge, Tennessee, U.S.A.
More Information Less Information
Figure 12 from 2017 W&W Report. Adapted from Meyer, S. R., C. S. Cronan, R. J. Lillieholm, M. L. Johnson, and D. R. Foster. 2014. Land conservation in northern New England: Historic trends and alternative conservation futures. Biological Conservation 174: 152–160.
More Information Less Information
Figure 7 from the 2017 W&W Report. Data from: Nowak, D. J., S. Hirabayashi, A. Bodine, and E. Greenfield. 2014. Tree and forest effects on air quality and human health in the United States. Environmental Pollution 193:119–129.
More Information Less Information
Figure 6 from 2017 W&W Report. 2011 Land cover data is from the NLCD: Homer, C. G. et al. 2015 (see cited ref #8). Watershed boundaries were simplified from the USGS hydrologic unit codes. Protected open space data is from Harvard Forest and Highstead.
More Information Less Information
Figure 3 from 2017 W&W Report. Modified from Foster and Aber (2004) with additional data from USFS FIA state reports. Foster, D. R. and J. D. Aber. 2004. Forests in time. Yale University Press, New Haven, CT.
More Information Less Information
Figure 2 from 2017 W&W Report - Data from: Hansen, M. C., R. S. DeFries, J. R. G. Townshend, M. Carroll, C. Dimiceli, and R. A. Sohlberg. 2003. Global percent tree cover at a spatial resolution of 500 meters: First results of the MODIS vegetation continuous fields algorithm. Earth Interactions 7:1–15.
1 2 3 4